Charts and data visualisation: live code examples
9 examples for 2 libraries. Open one to read how it works, run it in your browser and change it, by hand or with AI.
All 231 examples UI components and icons Utilities Forms, validation and schemas Animation and motion 3D and graphics Web frameworks State and data fetching Markdown, editors and content Files, images and media Styling and CSS Auth and security libraries HTTP clients and networking Game development
Recharts 4 examples · usage and stats
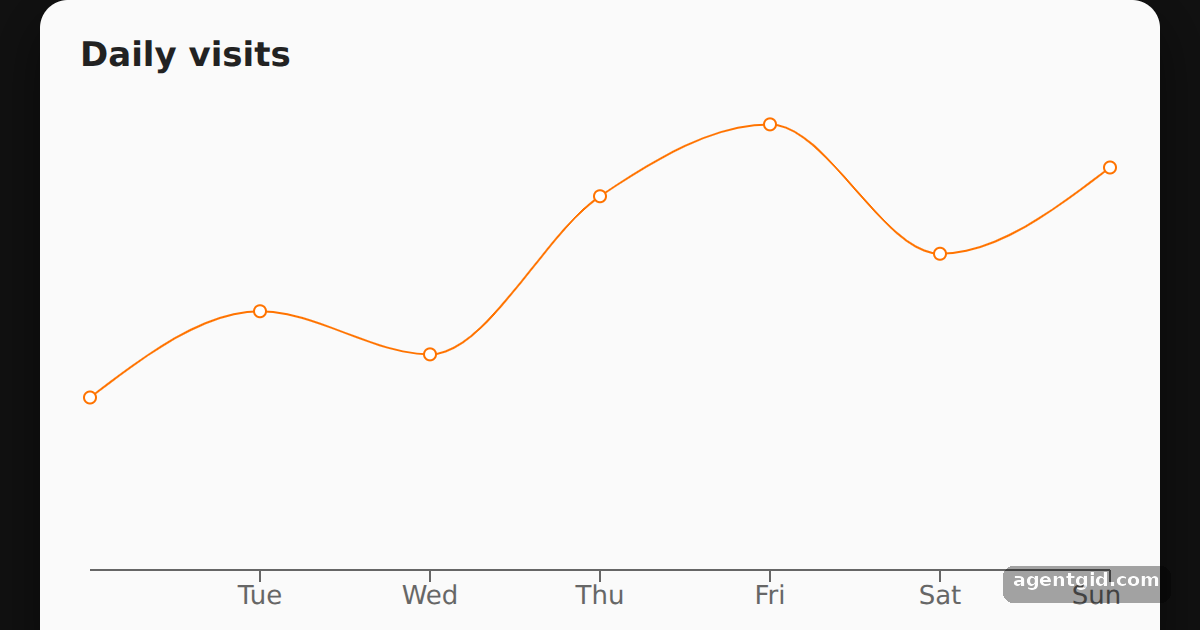 A simple line chart in RechartsChange a number in the data array and run it again to see the line move.
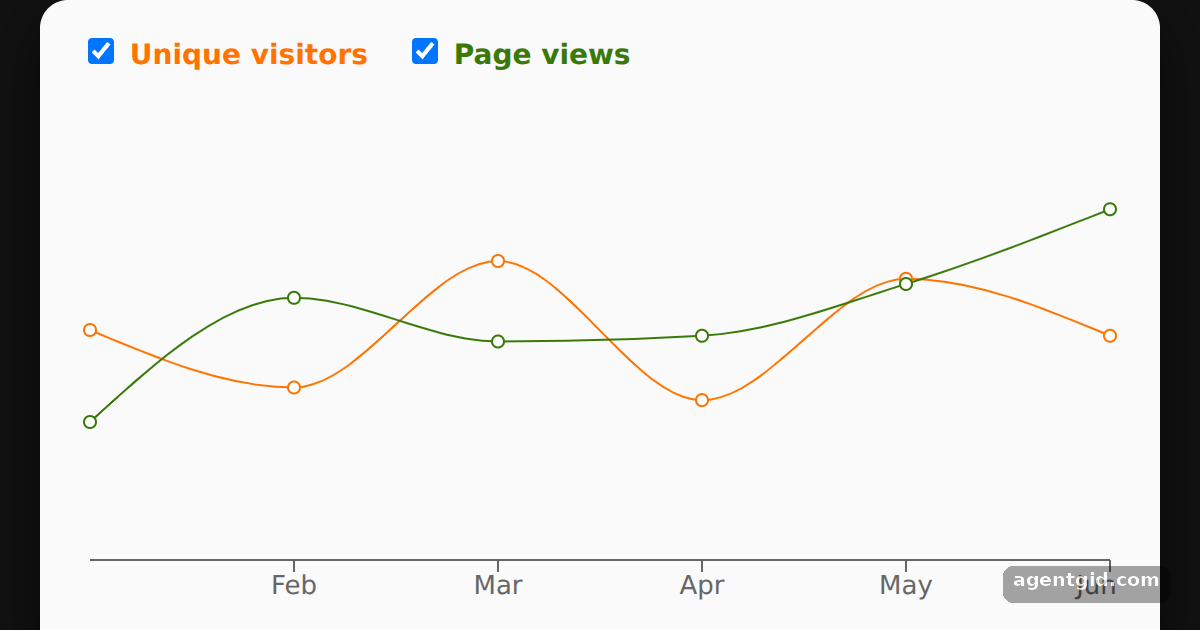 Multiple lines in one Recharts chartUntick one of the checkboxes to remove that line from the chart.
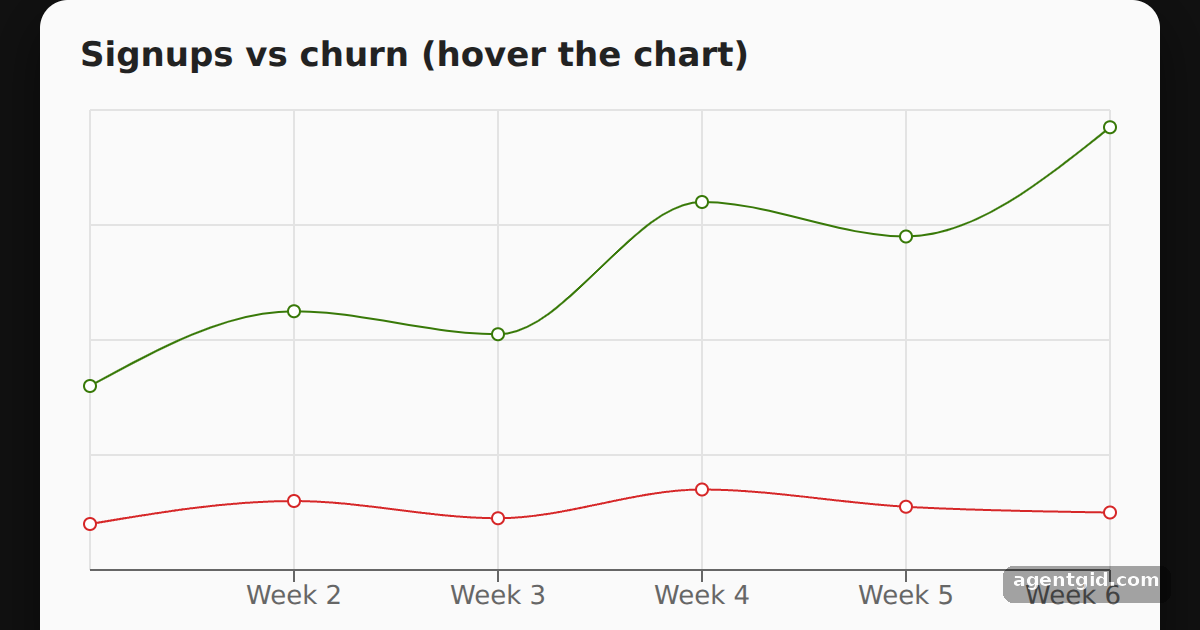 Tooltip and grid in a Recharts line chartHover over the chart to see the tooltip with both values for that week.
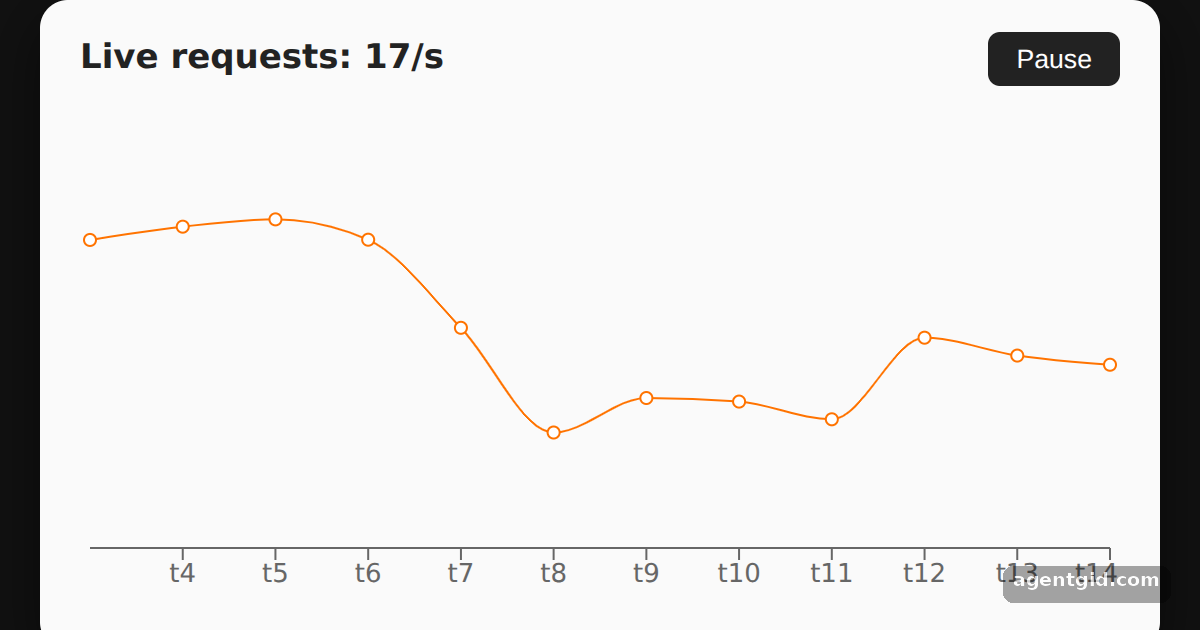 A live-updating line chart in RechartsWatch the line scroll left as new points arrive; press Pause to freeze it.
React Chart.js 2 5 examples · usage and stats
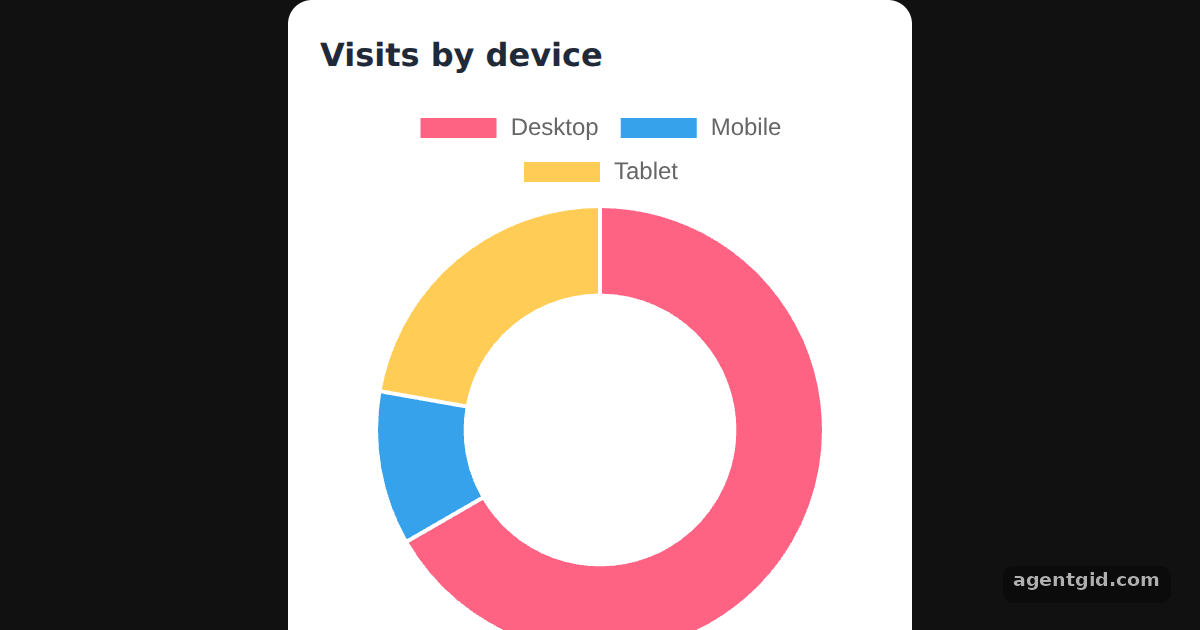 Doughnut chart in React Chart.js 2Hover a segment to see its tooltip; change cutout to 0 to turn the doughnut into a pie.
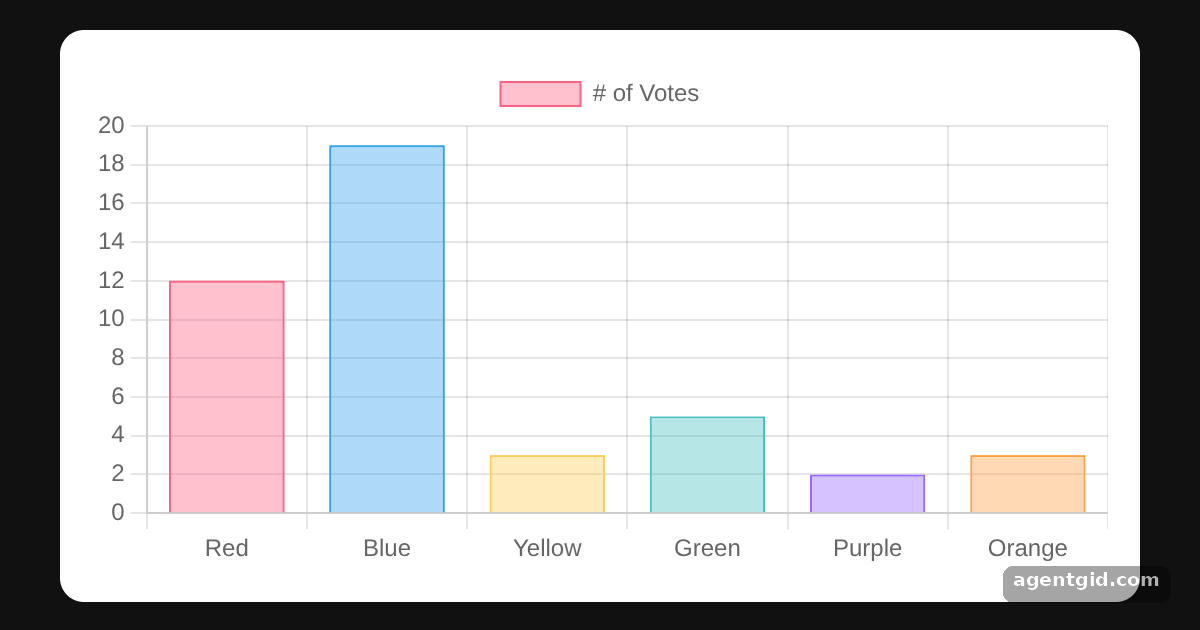 Bar chart in React Chart.js 2Change a number in the data array and the matching bar resizes.
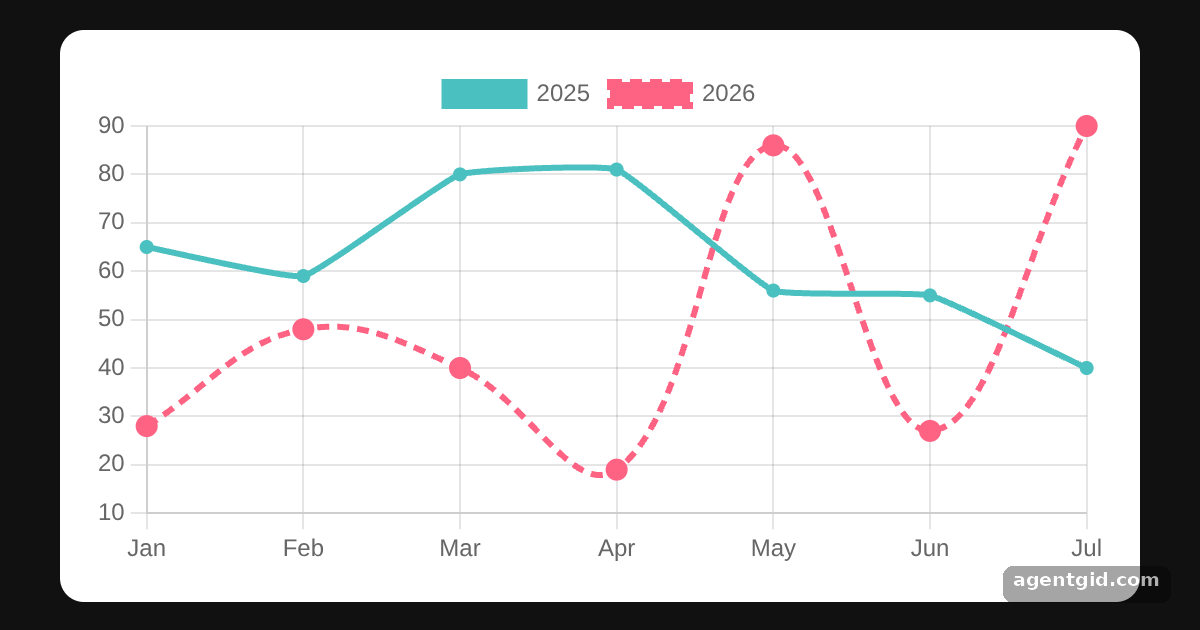 Line chart in React Chart.js 2Set tension to 0 on both datasets to get straight segments between the points.
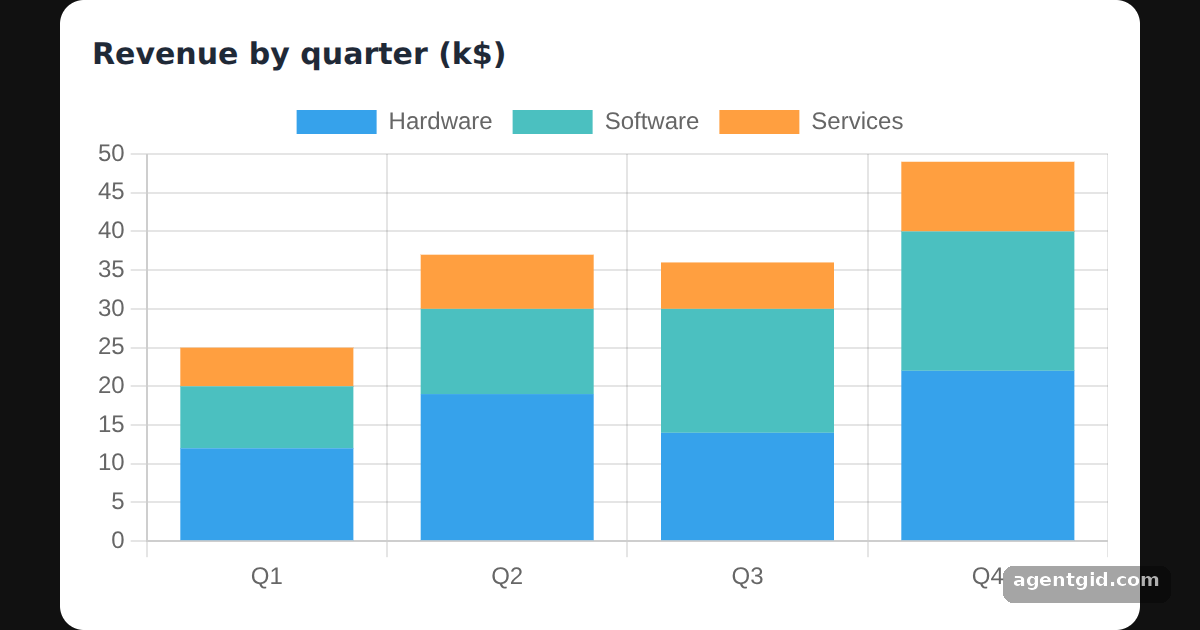 Stacked bar chart in React Chart.js 2Click a legend entry to hide that dataset and watch the stacks shrink.
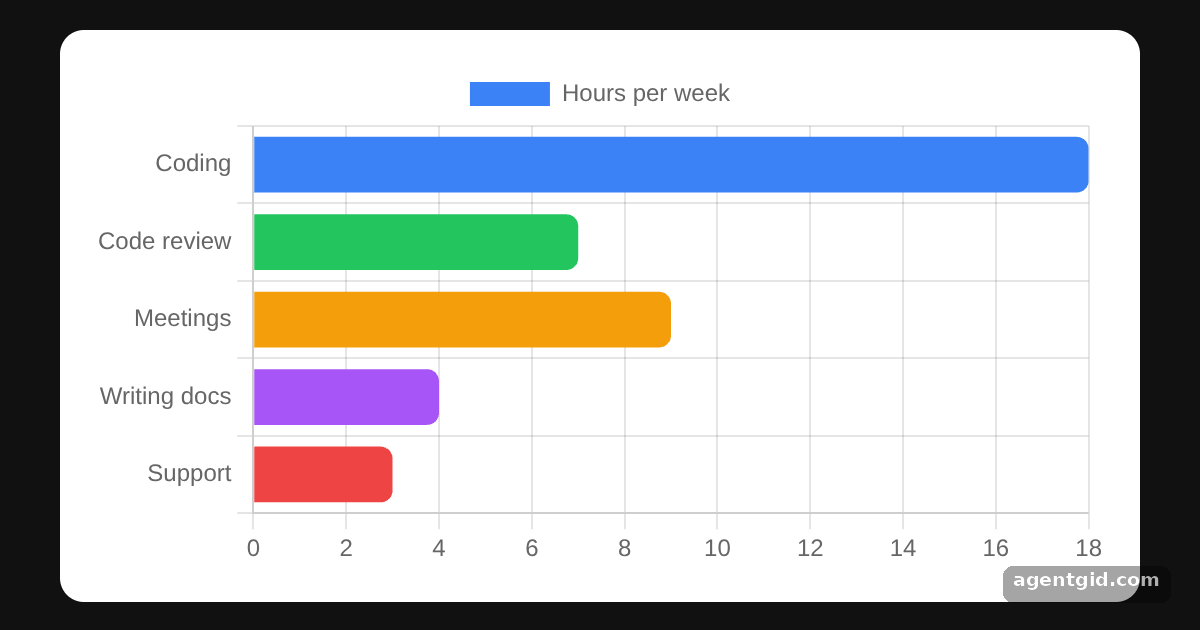 Horizontal bar chart in React Chart.js 2Delete the indexAxis line to see the same data as vertical bars.