Chart of the day
One chart a day from AgentGid's own data: merged pull requests by coding agent, incidents, price changes, downloads and the MCP servers real repos use. Every chart links to the page with the full numbers. Free to share with a link to AgentGid.
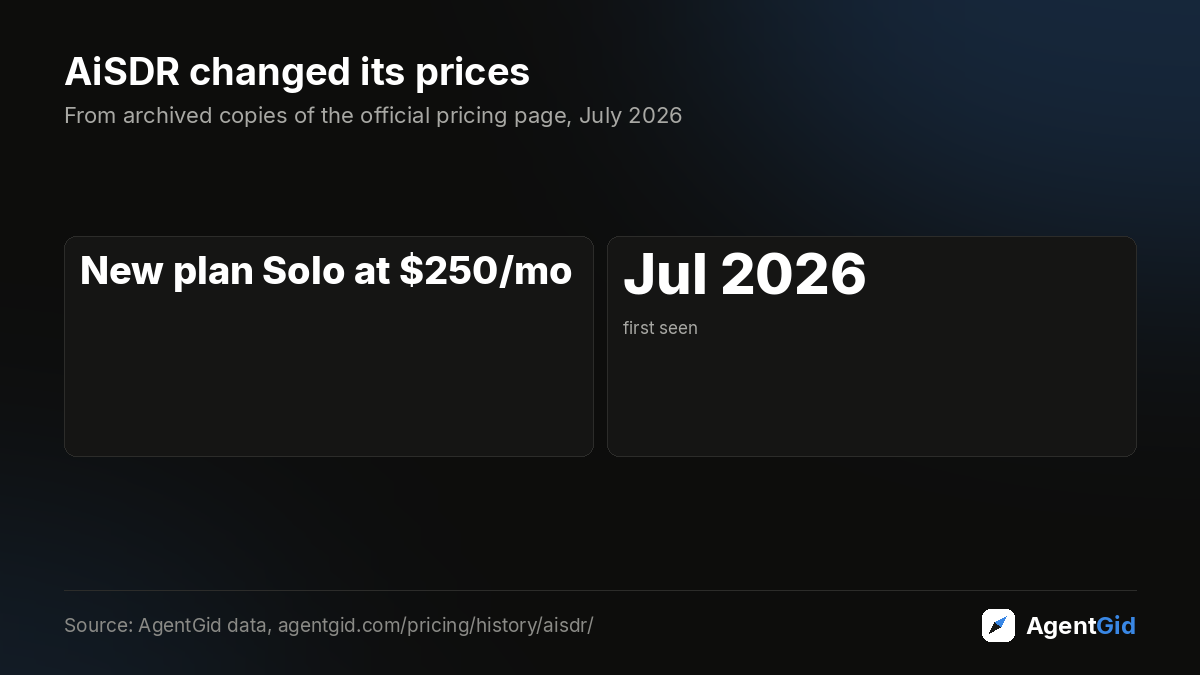
From archived copies of the official pricing page, July 2026. Full data →
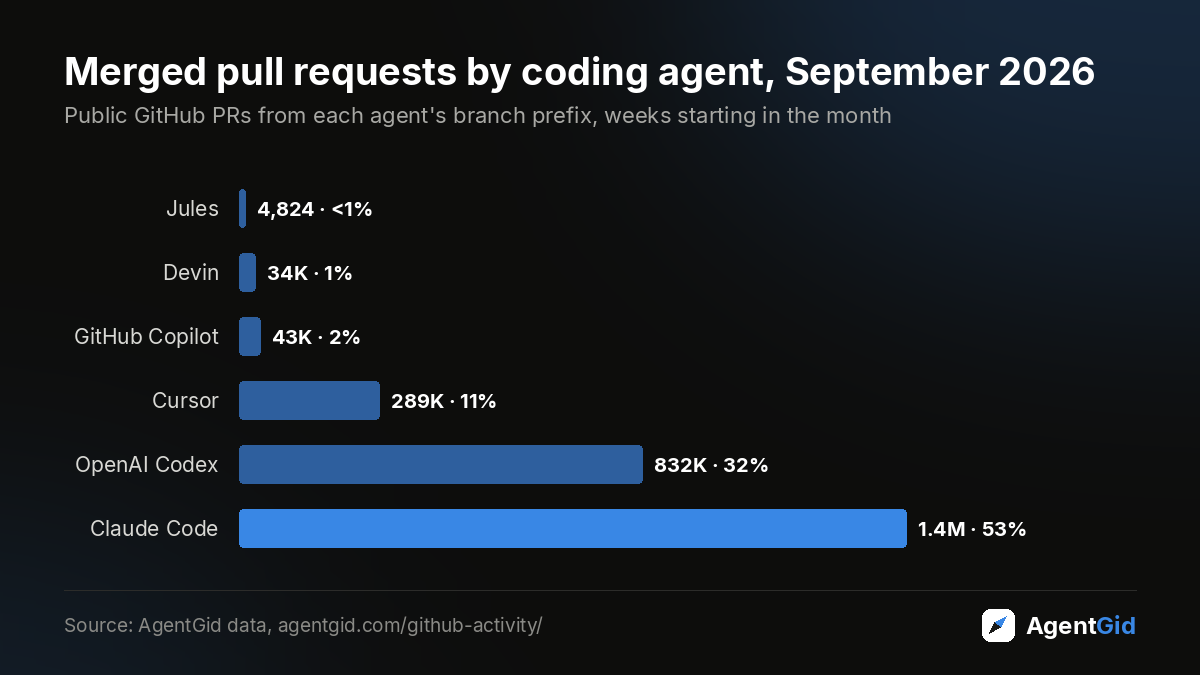
Public GitHub PRs from each agent's branch prefix, weeks starting in the month. Full data →